Note
Go to the end to download the full example code
Trifinder Event Demo#
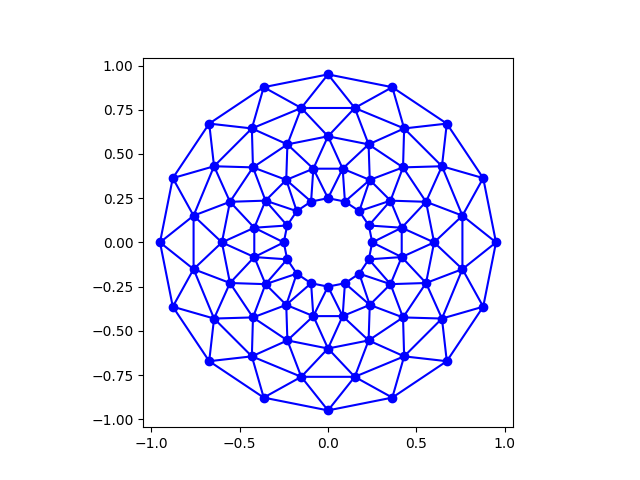
Example showing the use of a TriFinder object. As the mouse is moved over the triangulation, the triangle under the cursor is highlighted and the index of the triangle is displayed in the plot title.
Note
This example exercises the interactive capabilities of Matplotlib, and this will not appear in the static documentation. Please run this code on your machine to see the interactivity.
You can copy and paste individual parts, or download the entire example using the link at the bottom of the page.

import matplotlib.pyplot as plt
import numpy as np

from matplotlib.patches import Polygon
from matplotlib.tri import Triangulation


def update_polygon(tri):
    if tri == -1:
        points = [0, 0, 0]
    else:
        points = triang.triangles[tri]
    xs = triang.x[points]
    ys = triang.y[points]
    polygon.set_xy(np.column_stack([xs, ys]))


def on_mouse_move(event):
    if event.inaxes is None:
        tri = -1
    else:
        tri = trifinder(event.xdata, event.ydata)
    update_polygon(tri)
    ax.set_title(f'In triangle {tri}')
    event.canvas.draw()


# Create a Triangulation.
n_angles = 16
n_radii = 5
min_radius = 0.25
radii = np.linspace(min_radius, 0.95, n_radii)
angles = np.linspace(0, 2 * np.pi, n_angles, endpoint=False)
angles = np.repeat(angles[..., np.newaxis], n_radii, axis=1)
angles[:, 1::2] += np.pi / n_angles
x = (radii*np.cos(angles)).flatten()
y = (radii*np.sin(angles)).flatten()
triang = Triangulation(x, y)
triang.set_mask(np.hypot(x[triang.triangles].mean(axis=1),
                         y[triang.triangles].mean(axis=1))
                < min_radius)

# Use the triangulation's default TriFinder object.
trifinder = triang.get_trifinder()

# Setup plot and callbacks.
fig, ax = plt.subplots(subplot_kw={'aspect': 'equal'})
ax.triplot(triang, 'bo-')
polygon = Polygon([[0, 0], [0, 0]], facecolor='y')  # dummy data for (xs, ys)
update_polygon(-1)
ax.add_patch(polygon)
fig.canvas.mpl_connect('motion_notify_event', on_mouse_move)
plt.show()