Note
Go to the end to download the full example code
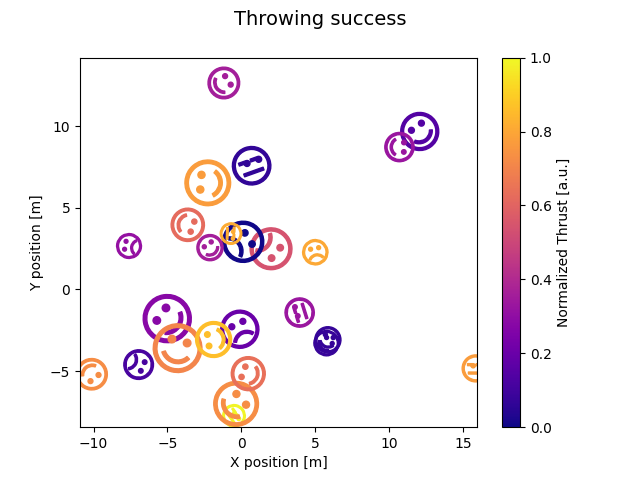
Mapping marker properties to multivariate data#
This example shows how to use different properties of markers to plot multivariate datasets. Here we represent a successful baseball throw as a smiley face with marker size mapped to the skill of thrower, marker rotation to the take-off angle, and thrust to the marker color.
import matplotlib.pyplot as plt
import numpy as np

from matplotlib.colors import Normalize
from matplotlib.markers import MarkerStyle
from matplotlib.text import TextPath
from matplotlib.transforms import Affine2D

SUCCESS_SYMBOLS = [
    TextPath((0, 0), "☹"),
    TextPath((0, 0), "😒"),
    TextPath((0, 0), "☺"),
]

N = 25
np.random.seed(42)
skills = np.random.uniform(5, 80, size=N) * 0.1 + 5
takeoff_angles = np.random.normal(0, 90, N)
thrusts = np.random.uniform(size=N)
successful = np.random.randint(0, 3, size=N)
positions = np.random.normal(size=(N, 2)) * 5
data = zip(skills, takeoff_angles, thrusts, successful, positions)

cmap = plt.colormaps["plasma"]
fig, ax = plt.subplots()
fig.suptitle("Throwing success", size=14)
for skill, takeoff, thrust, mood, pos in data:
    t = Affine2D().scale(skill).rotate_deg(takeoff)
    m = MarkerStyle(SUCCESS_SYMBOLS[mood], transform=t)
    ax.plot(pos[0], pos[1], marker=m, color=cmap(thrust))
fig.colorbar(plt.cm.ScalarMappable(norm=Normalize(0, 1), cmap=cmap),
             ax=ax, label="Normalized Thrust [a.u.]")
ax.set_xlabel("X position [m]")
ax.set_ylabel("Y position [m]")

plt.show()