matplotlib.axes.Axes.add_patch#
Examples using matplotlib.axes.Axes.add_patch#


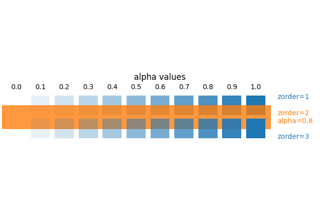
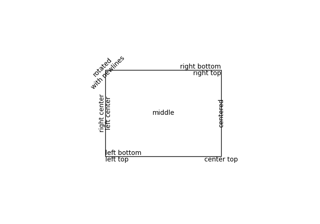
Controlling view limits using margins and sticky_edges
Controlling view limits using margins and sticky_edges
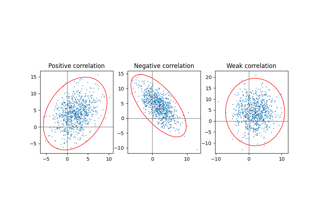
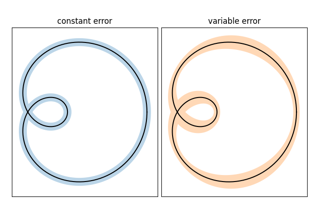
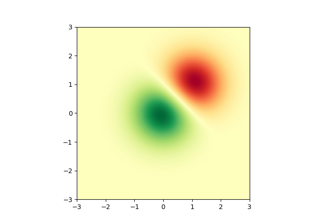
Plot a confidence ellipse of a two-dimensional dataset
Plot a confidence ellipse of a two-dimensional dataset


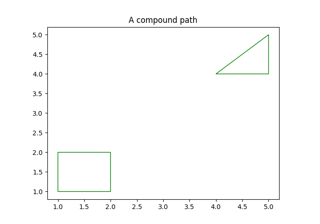


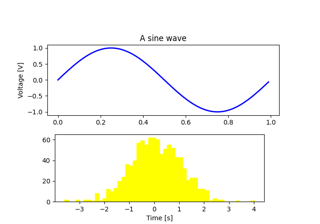
Building histograms using Rectangles and PolyCollections
Building histograms using Rectangles and PolyCollections