Note
Go to the end to download the full example code
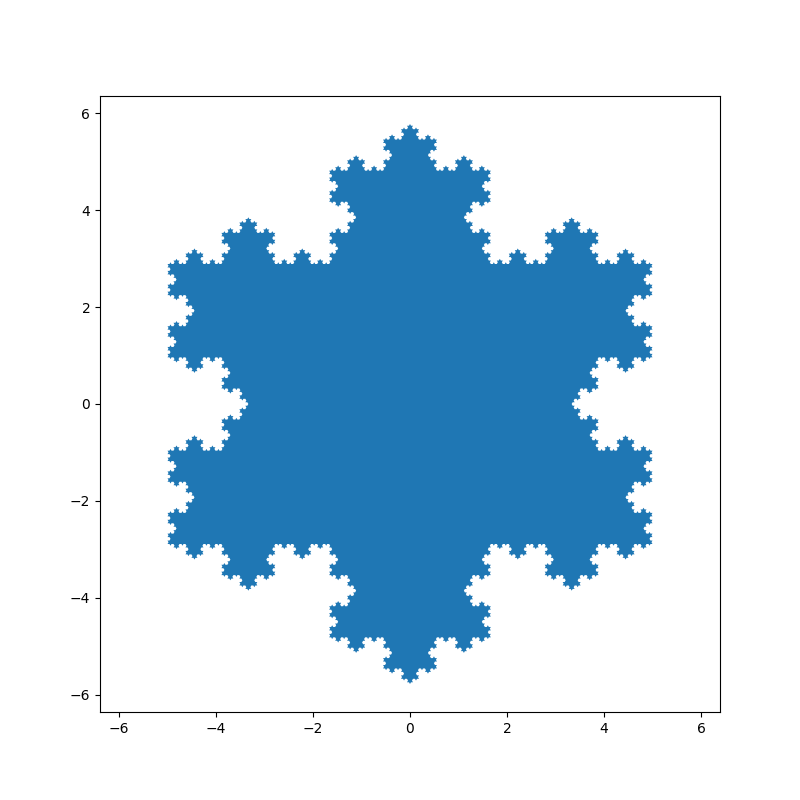
Filled polygon#
fill() draws a filled polygon based on lists of point
coordinates x, y.
This example uses the Koch snowflake as an example polygon.
import matplotlib.pyplot as plt
import numpy as np


def koch_snowflake(order, scale=10):
    """
    Return two lists x, y of point coordinates of the Koch snowflake.

    Parameters
    ----------
    order : int
        The recursion depth.
    scale : float
        The extent of the snowflake (edge length of the base triangle).
    """
    def _koch_snowflake_complex(order):
        if order == 0:
            # initial triangle
            angles = np.array([0, 120, 240]) + 90
            return scale / np.sqrt(3) * np.exp(np.deg2rad(angles) * 1j)
        else:
            ZR = 0.5 - 0.5j * np.sqrt(3) / 3

            p1 = _koch_snowflake_complex(order - 1)  # start points
            p2 = np.roll(p1, shift=-1)  # end points
            dp = p2 - p1  # connection vectors

            new_points = np.empty(len(p1) * 4, dtype=np.complex128)
            new_points[::4] = p1
            new_points[1::4] = p1 + dp / 3
            new_points[2::4] = p1 + dp * ZR
            new_points[3::4] = p1 + dp / 3 * 2
            return new_points

    points = _koch_snowflake_complex(order)
    x, y = points.real, points.imag
    return x, y
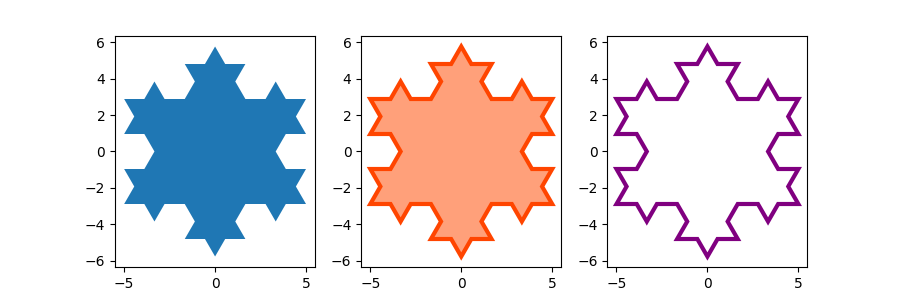
Basic usage:
Use keyword arguments facecolor and edgecolor to modify the colors of the polygon. Since the linewidth of the edge is 0 in the default Matplotlib style, we have to set it as well for the edge to become visible.
References
The use of the following functions, methods, classes and modules is shown in this example: