Note
Go to the end to download the full example code
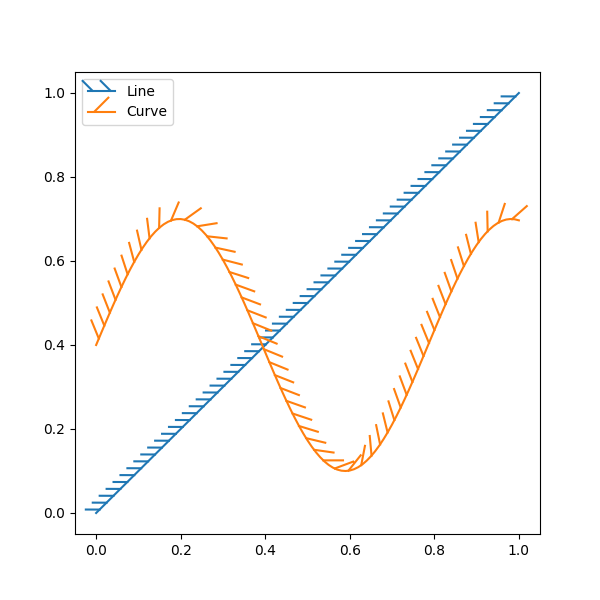
Lines with a ticked patheffect#
Ticks can be added along a line to mark one side as a barrier using
TickedStroke. You can control the angle,
spacing, and length of the ticks.
The ticks will also appear appropriately in the legend.
import matplotlib.pyplot as plt
import numpy as np

from matplotlib import patheffects

# Plot a straight diagonal line with ticked style path
fig, ax = plt.subplots(figsize=(6, 6))
ax.plot([0, 1], [0, 1], label="Line",
        path_effects=[patheffects.withTickedStroke(spacing=7, angle=135)])

# Plot a curved line with ticked style path
nx = 101
x = np.linspace(0.0, 1.0, nx)
y = 0.3*np.sin(x*8) + 0.4
ax.plot(x, y, label="Curve", path_effects=[patheffects.withTickedStroke()])

ax.legend()

plt.show()