Note
Go to the end to download the full example code
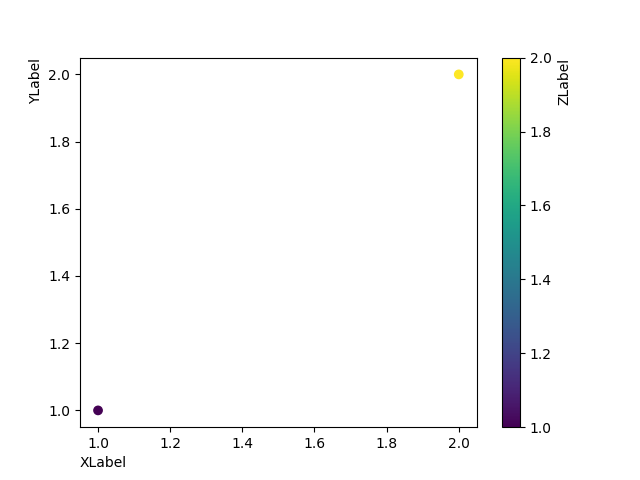
Axis Label Position#
Choose axis label position when calling set_xlabel and
set_ylabel as well as for colorbar.
import matplotlib.pyplot as plt

fig, ax = plt.subplots()

sc = ax.scatter([1, 2], [1, 2], c=[1, 2])
ax.set_ylabel('YLabel', loc='top')
ax.set_xlabel('XLabel', loc='left')
cbar = fig.colorbar(sc)
cbar.set_label("ZLabel", loc='top')

plt.show()