Note
Go to the end to download the full example code
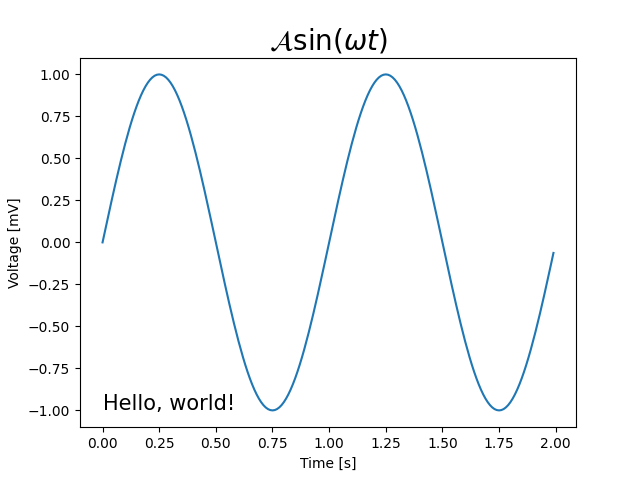
Text and mathtext using pyplot#
Set the special text objects title, xlabel, and
ylabel through the dedicated pyplot functions. Additional text
objects can be placed in the axes using text.
You can use TeX-like mathematical typesetting in all texts; see also Writing mathematical expressions.
References
The use of the following functions, methods, classes and modules is shown in this example: