Note
Go to the end to download the full example code
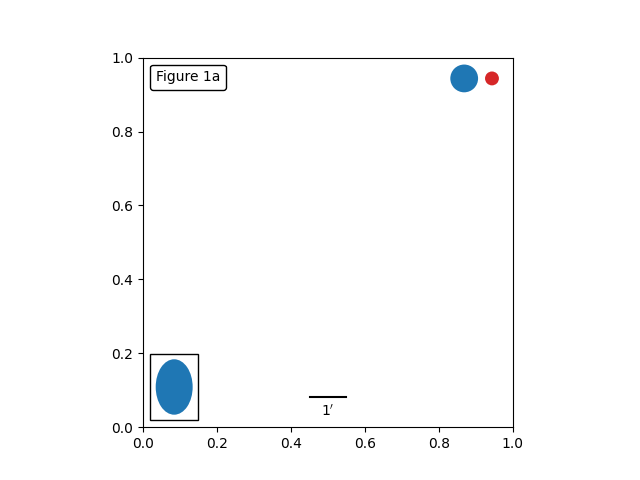
Anchored Artists#
This example illustrates the use of the anchored objects without the
helper classes found in mpl_toolkits.axes_grid1. This version
of the figure is similar to the one found in
Simple Anchored Artists, but it is
implemented using only the matplotlib namespace, without the help
of additional toolkits.
from matplotlib import pyplot as plt
from matplotlib.lines import Line2D
from matplotlib.offsetbox import (AnchoredOffsetbox, AuxTransformBox,
                                  DrawingArea, TextArea, VPacker)
from matplotlib.patches import Circle, Ellipse


def draw_text(ax):
    """Draw a text-box anchored to the upper-left corner of the figure."""
    box = AnchoredOffsetbox(child=TextArea("Figure 1a"),
                            loc="upper left", frameon=True)
    box.patch.set_boxstyle("round,pad=0.,rounding_size=0.2")
    ax.add_artist(box)


def draw_circles(ax):
    """Draw circles in axes coordinates."""
    area = DrawingArea(width=40, height=20)
    area.add_artist(Circle((10, 10), 10, fc="tab:blue"))
    area.add_artist(Circle((30, 10), 5, fc="tab:red"))
    box = AnchoredOffsetbox(
        child=area, loc="upper right", pad=0, frameon=False)
    ax.add_artist(box)


def draw_ellipse(ax):
    """Draw an ellipse of width=0.1, height=0.15 in data coordinates."""
    aux_tr_box = AuxTransformBox(ax.transData)
    aux_tr_box.add_artist(Ellipse((0, 0), width=0.1, height=0.15))
    box = AnchoredOffsetbox(child=aux_tr_box, loc="lower left", frameon=True)
    ax.add_artist(box)


def draw_sizebar(ax):
    """
    Draw a horizontal bar with length of 0.1 in data coordinates,
    with a fixed label center-aligned underneath.
    """
    size = 0.1
    text = r"1$^{\prime}$"
    sizebar = AuxTransformBox(ax.transData)
    sizebar.add_artist(Line2D([0, size], [0, 0], color="black"))
    text = TextArea(text)
    packer = VPacker(
        children=[sizebar, text], align="center", sep=5)  # separation in points.
    ax.add_artist(AnchoredOffsetbox(
        child=packer, loc="lower center", frameon=False,
        pad=0.1, borderpad=0.5))  # paddings relative to the legend fontsize.


fig, ax = plt.subplots()
ax.set_aspect(1)

draw_text(ax)
draw_circles(ax)
draw_ellipse(ax)
draw_sizebar(ax)

plt.show()