Note
Go to the end to download the full example code
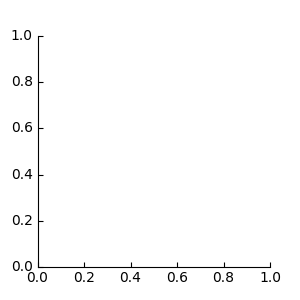
Simple Axisline3#

import matplotlib.pyplot as plt

from mpl_toolkits.axisartist.axislines import Axes

fig = plt.figure(figsize=(3, 3))

ax = fig.add_subplot(axes_class=Axes)

ax.axis["right"].set_visible(False)
ax.axis["top"].set_visible(False)

plt.show()