Note
Go to the end to download the full example code
MRI with EEG#
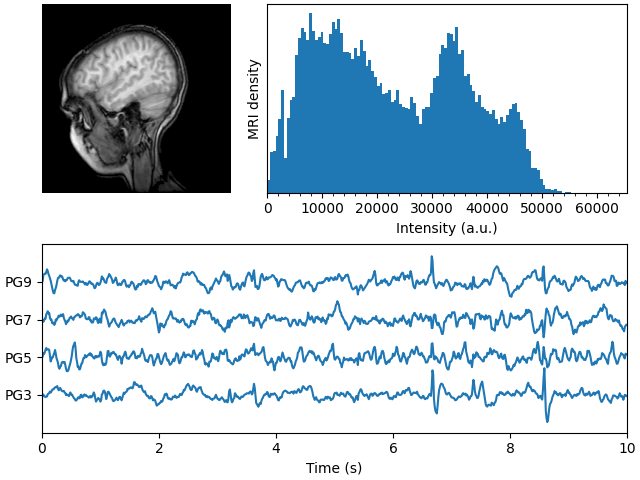
Displays a set of subplots with an MRI image, its intensity histogram and some EEG traces.

import matplotlib.pyplot as plt
import numpy as np

import matplotlib.cbook as cbook

fig, axd = plt.subplot_mosaic(
    [["image", "density"],
     ["EEG", "EEG"]],
    layout="constrained",
    # "image" will contain a square image. We fine-tune the width so that
    # there is no excess horizontal or vertical margin around the image.
    width_ratios=[1.05, 2],
)

# Load the MRI data (256x256 16-bit integers)
with cbook.get_sample_data('s1045.ima.gz') as dfile:
    im = np.frombuffer(dfile.read(), np.uint16).reshape((256, 256))

# Plot the MRI image
axd["image"].imshow(im, cmap="gray")
axd["image"].axis('off')

# Plot the histogram of MRI intensity
im = im[im.nonzero()]  # Ignore the background
axd["density"].hist(im, bins=np.arange(0, 2**16+1, 512))
axd["density"].set(xlabel='Intensity (a.u.)', xlim=(0, 2**16),
                   ylabel='MRI density', yticks=[])
axd["density"].minorticks_on()

# Load the EEG data
n_samples, n_rows = 800, 4
with cbook.get_sample_data('eeg.dat') as eegfile:
    data = np.fromfile(eegfile, dtype=float).reshape((n_samples, n_rows))
t = 10 * np.arange(n_samples) / n_samples

# Plot the EEG
axd["EEG"].set_xlabel('Time (s)')
axd["EEG"].set_xlim(0, 10)
dy = (data.min() - data.max()) * 0.7  # Crowd them a bit.
axd["EEG"].set_ylim(-dy, n_rows * dy)
axd["EEG"].set_yticks([0, dy, 2*dy, 3*dy], labels=['PG3', 'PG5', 'PG7', 'PG9'])

for i, data_col in enumerate(data.T):
    axd["EEG"].plot(t, data_col + i*dy, color="C0")

plt.show()