Note
Go to the end to download the full example code
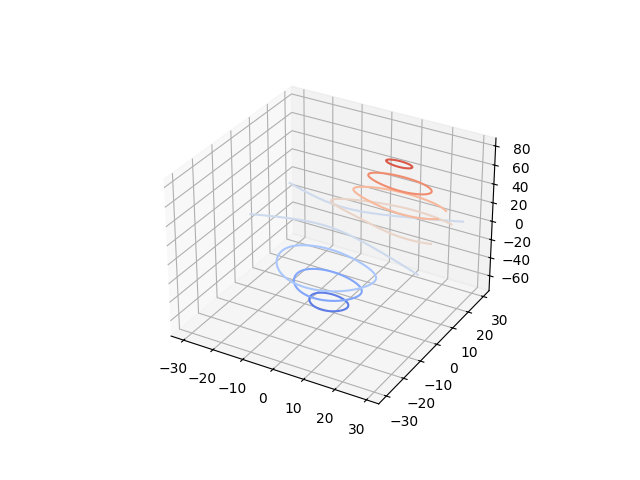
Plot contour (level) curves in 3D#
This is like a contour plot in 2D except that the f(x, y)=c curve is
plotted on the plane z=c.
import matplotlib.pyplot as plt

from matplotlib import cm
from mpl_toolkits.mplot3d import axes3d

ax = plt.figure().add_subplot(projection='3d')
X, Y, Z = axes3d.get_test_data(0.05)

ax.contour(X, Y, Z, cmap=cm.coolwarm)  # Plot contour curves

plt.show()