Note
Go to the end to download the full example code
Barcode#
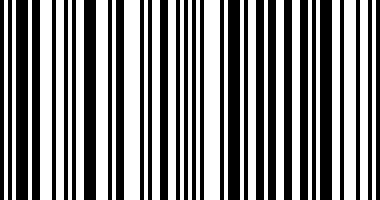
This demo shows how to produce a bar code.
The figure size is calculated so that the width in pixels is a multiple of the
number of data points to prevent interpolation artifacts. Additionally, the
Axes is defined to span the whole figure and all Axis are turned off.
The data itself is rendered with imshow using
code.reshape(1, -1)to turn the data into a 2D array with one row.imshow(..., aspect='auto')to allow for non-square pixels.imshow(..., interpolation='nearest')to prevent blurred edges. This should not happen anyway because we fine-tuned the figure width in pixels, but just to be safe.
import matplotlib.pyplot as plt
import numpy as np

code = np.array([
    1, 0, 1, 0, 1, 1, 1, 0, 1, 1, 0, 0, 0, 1, 0, 0, 1, 0, 1, 0, 0, 1, 1, 1,
    0, 0, 0, 1, 0, 1, 1, 0, 0, 0, 0, 1, 0, 1, 0, 0, 1, 1, 0, 0, 1, 0, 1, 0,
    1, 0, 1, 0, 0, 0, 0, 1, 0, 1, 1, 1, 0, 1, 0, 0, 1, 1, 0, 1, 1, 0, 0, 1,
    1, 0, 0, 1, 1, 0, 1, 0, 1, 1, 1, 0, 0, 1, 0, 0, 0, 1, 0, 0, 1, 0, 1])

pixel_per_bar = 4
dpi = 100

fig = plt.figure(figsize=(len(code) * pixel_per_bar / dpi, 2), dpi=dpi)
ax = fig.add_axes([0, 0, 1, 1])  # span the whole figure
ax.set_axis_off()
ax.imshow(code.reshape(1, -1), cmap='binary', aspect='auto',
          interpolation='nearest')
plt.show()

References
The use of the following functions, methods, classes and modules is shown in this example: