Note
Go to the end to download the full example code
Managing multiple figures in pyplot#
matplotlib.pyplot uses the concept of a current figure and current axes.
Figures are identified via a figure number that is passed to figure.
The figure with the given number is set as current figure. Additionally, if
no figure with the number exists, a new one is created.
Note
We discourage working with multiple figures through the implicit pyplot interface because managing the current figure is cumbersome and error-prone. Instead, we recommend using the explicit approach and call methods on Figure and Axes instances. See Matplotlib Application Interfaces (APIs) for an explanation of the trade-offs between the implicit and explicit interfaces.
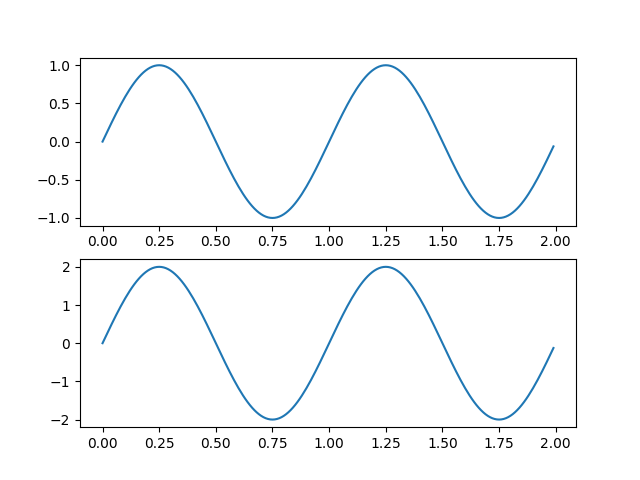
Create figure 1
plt.figure(1)
plt.subplot(211)
plt.plot(t, s1)
plt.subplot(212)
plt.plot(t, 2*s1)
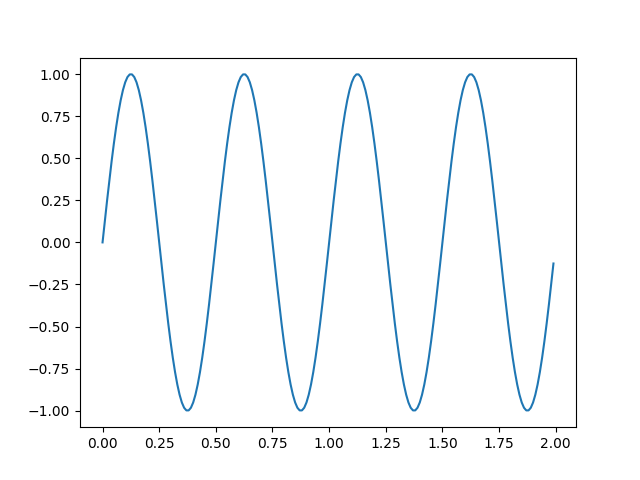
Create figure 2
plt.figure(2)
plt.plot(t, s2)
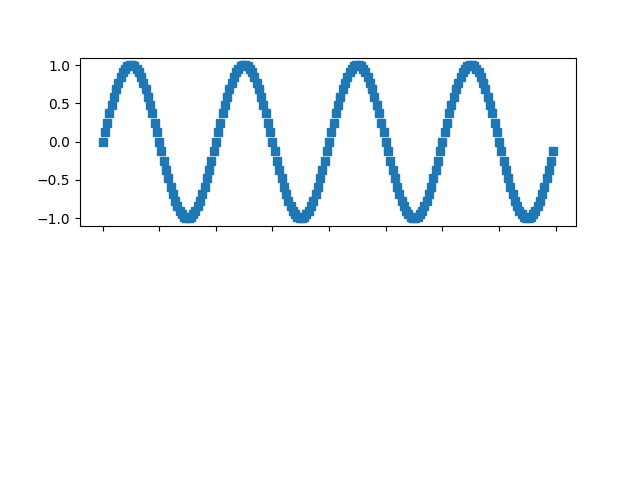
Now switch back to figure 1 and make some changes
plt.figure(1)
plt.subplot(211)
plt.plot(t, s2, 's')
ax = plt.gca()
ax.set_xticklabels([])

plt.show()