matplotlib.axes.Axes.get_ylim#
- Axes.get_ylim()[source]#
Return the y-axis view limits.
- Returns:
- bottom, top(float, float)
The current y-axis limits in data coordinates.
Notes
The y-axis may be inverted, in which case the bottom value will be greater than the top value.
Examples using matplotlib.axes.Axes.get_ylim#
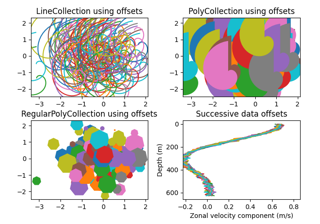
Line, Poly and RegularPoly Collection with autoscaling
Line, Poly and RegularPoly Collection with autoscaling