Note
Go to the end to download the full example code
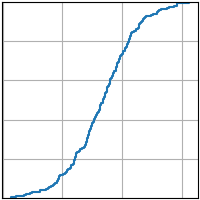
ecdf(x)#
See ecdf.
import matplotlib.pyplot as plt
import numpy as np

plt.style.use('_mpl-gallery')

# make data
np.random.seed(1)
x = 4 + np.random.normal(0, 1.5, 200)

# plot:
fig, ax = plt.subplots()
ax.ecdf(x)
plt.show()