Note
Go to the end to download the full example code
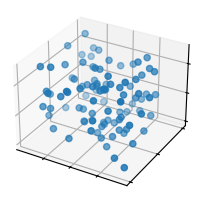
scatter(xs, ys, zs)#
See scatter.
import matplotlib.pyplot as plt
import numpy as np

plt.style.use('_mpl-gallery')

# Make data
np.random.seed(19680801)
n = 100
rng = np.random.default_rng()
xs = rng.uniform(23, 32, n)
ys = rng.uniform(0, 100, n)
zs = rng.uniform(-50, -25, n)

# Plot
fig, ax = plt.subplots(subplot_kw={"projection": "3d"})
ax.scatter(xs, ys, zs)

ax.set(xticklabels=[],
       yticklabels=[],
       zticklabels=[])

plt.show()