Figures and backends#
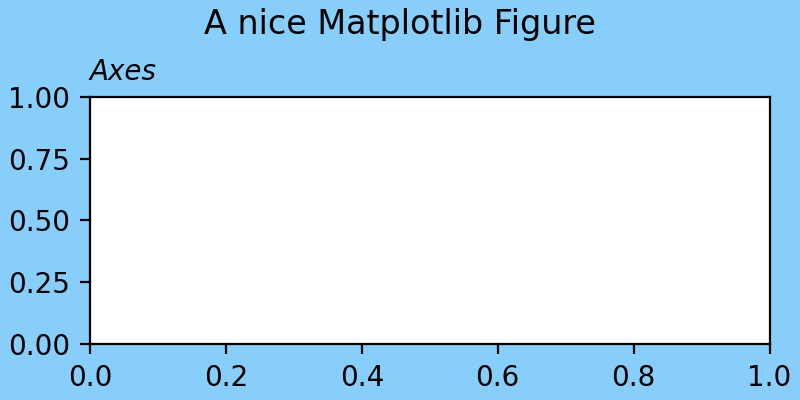
When looking at Matplotlib visualization, you are almost always looking at
Artists placed on a Figure. In the example below, the figure is the
blue region and add_subplot has added an Axes artist to the
Figure (see Parts of a Figure). A more complicated visualization can add
multiple Axes to the Figure, colorbars, legends, annotations, and the Axes
themselves can have multiple Artists added to them
(e.g. ax.plot or ax.imshow).
fig = plt.figure(figsize=(4, 2), facecolor='lightskyblue',
                 layout='constrained')
fig.suptitle('A nice Matplotlib Figure')
ax = fig.add_subplot()
ax.set_title('Axes', loc='left', fontstyle='oblique', fontsize='medium')
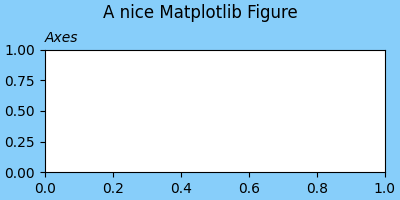
(Source code, 2x.png, png)
